Irish National Farm Survey Enterprise Factsheets Published
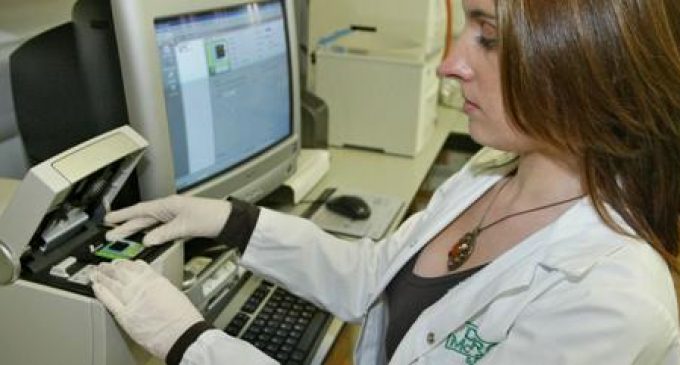
Teagasc (the Irish Agriculture and Food Development Authority) has published its annual farm enterprise level analysis based on its National Farm Survey (NFS) for 2016. In contrast to measures of overall farm performance, the enterprise level analysis shows the contribution of each type of farm activity to the farm’s overall profitability. These farm enterprise results detail the output, costs of production and margins achieved by dairy, cattle, lamb and various tillage crop enterprises.
The results highlight the wide range of cost structures that exist and income levels that are achieved within farm enterprise categories.
On the cattle finishing enterprises there was a growth in average gross margin per hectare of 18%, due to increased output value arising from a higher level of production. Similarly for the mid-season lamb enterprise, growth in output value led to an increase in average gross margin per hectare of 22% in 2016.
In contrast, on single suckling enterprises, output value contracted in 2016 and the average gross margin per hectare declined by 7%.
In the case of tillage, lower yields and lower prices led to a decline in the average gross margin, in 2016, despite a fall in the cost of production. Average gross margin per hectare declined by 11% for spring barley and 19% for winter wheat.
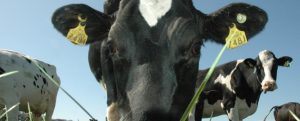 The 2016 NFS dairy fact sheet shows that the average gross margin was 16.02 cent per litre, down 18 per cent on the previous year while the average net margin was 6.72 cent per litre. The Teagasc figures show that the average producer had total milk production costs of about 22 cent per litre in 2016. However, less efficient producers have milk production costs which are well above this average, while the most efficient producers have production costs that are below 20 cent per litre.
In line with EU requirements for international comparisons, the Teagasc NFS analysis includes hired labour within its definition of production costs. However, labour supplied by the farm operator and family members (so called own labour) is not included as a production cost, since the income of the farm is considered to provide a return to own labour, as well as the land and capital tied up in the farm.
 The Teagasc NFS has now assessed the own labour input for Irish dairy enterprises, allowing it to be expressed on a per litre of milk equivalent basis. The results for 2016 show that on the average dairy farm, the own labour input for the dairy enterprise was equivalent to about 12 cent per litre with a wide variation around this average. This rough estimate is based on an assessment of own labour input self-reported by the farmer and an assumed wage of €15 per hour. A considerable amount of painstaking research is required to improve the accuracy of this estimate. On a per litre basis, the own labour input required for smaller herds, with low yielding cows, a less desirable farm layout and inferior yard and parlour facilities is typically several cents higher than the own labour cost per litre on the average farm. By contrast the more labour efficient farms have an own labour input requirement which can be several cent lower than the average. The own labour input requirement can also be affected by decisions taken by the operator about the amount of hired labour to be used, given that hired labour can be substituted for own labour to some degree.
Teagasc has also published the Final National Farm Survey Report for 2016 (preliminary estimates published on 31 May 2017). The report shows the level of profitability, support payments and farm income derived across the farm sector in Ireland.
The results for 2016 show the continuing disparity between the levels of income achieved in different farm systems, with dairy farms once again showing the highest average income level and beef systems the lowest average income level.
Average dairy farm income in 2016 was down about €10,000 on the 2015 level to about €52,000. Average incomes on drystock farms ranged from €12,500 to €17,000 and were broadly similar to the 2015 level. The results also highlight the fall in income which occurred on tillage farms in 2016.
The Teagasc NFS Report and the associated NFS Farm Enterprise Factsheets for 2016 are available at www.teagasc.ie/publications .
Cattle Finishing Factsheet – https://www.teagasc.ie/media/website/publications/2017/NFS-2016-Cattle-Finishing-Enterprise-Factsheet.pdf
Cereal Enterprise Factsheet https://www.teagasc.ie/media/website/publications/2017/NFS-2016-Cereals-Enterprise-Factsheet.pdf
Dairy Enterprise Factsheet – https://www.teagasc.ie/media/website/publications/2017/NFS-2016-Dairy-Enterprise-Factsheet.pdf
Sheep Enterprise Factsheet https://www.teagasc.ie/media/website/publications/2017/NFS-2016-Sheep-Enterprise-Factsheet.pdf
Single Suckling Enterprise Factsheethttps://www.teagasc.ie/media/website/publications/2017/NFS-2016-Single-Suckling-Factsheet.pdf
2016 Teagasc National Farm Survey Reporthttps://www.teagasc.ie/media/website/publications/2017/NFS-2016-Final-Report.pdf


